Dashboard | Relianoid Enterprise 6.2 #
The dashboard shows an up-to-date status of the entire load balance appliance i.e. CPU and memory usage, the load, connections, system information, farm status, configured, e.t.c.
The dashboard has three main sections:
System Stats
Farms
Network Interfaces
System Stats #
This section shows the most recent data about resource usage by the host or a farm. We’ve represented the information in graphs. Refer to the images below.
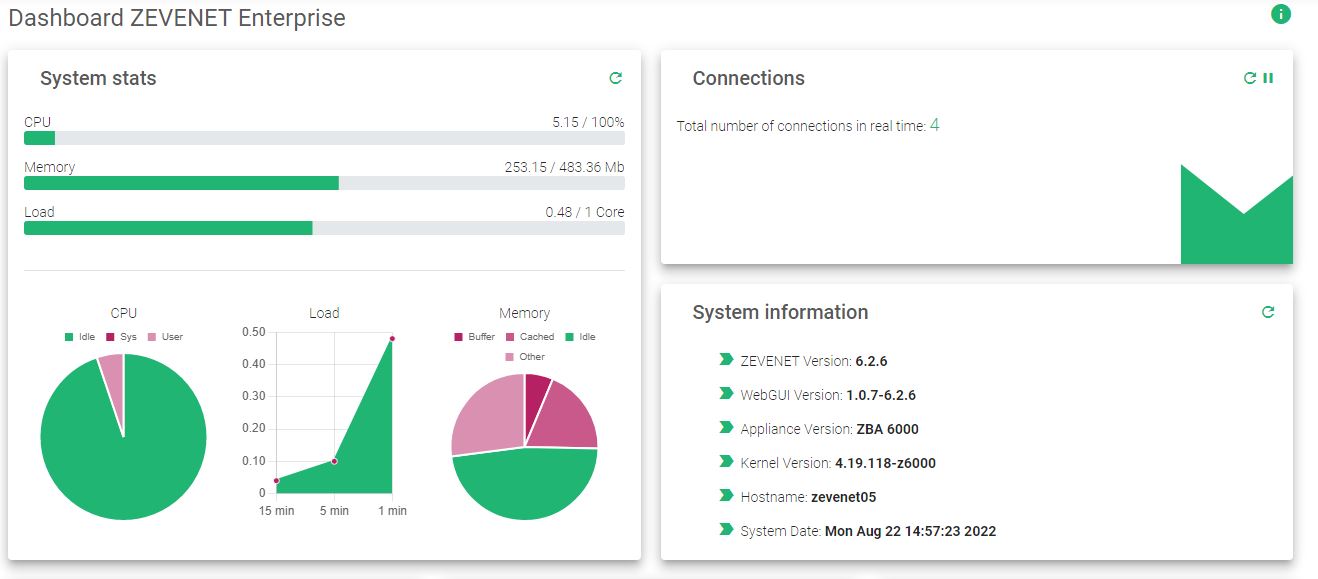
To refresh the data on each graph, click the green refresh button on the top right corner of each subsection.
CPU Usage #
These are the measurements of the CPU’s availability. The measurements are represented in percentages on the graphs.
Free. Amount of CPU resources not in use.
User. Use of processes in the userspace. For example HTTP/S load balance cores, administration web server, etc.
Nice. Use of prioritized processes in the system.
System. Usage of kernel space processes like L4 farms, network drivers, etc.
Iowait. Use of Input/Output tasks like disk or networking.
Irq. Interruption rate by signals to the processor.
Softirq. Short interruptions of the serving software to the processor.
Memory Usage #
Free. The amount of memory available to the system.
Used. The amount of memory used by the kernel and the processor.
Cached. Volatile memory that is allocated on the processor.
Buffers. This is the memory used to compensate or balance transfer speed between the processor and the storage units.
Load Usage #
Shows the number of loads per core and the history of progress segmented from 1, 5, to 15 minutes.
Connections Graph #
The connection graph shows real-time data of the entire application and is auto-updated every 5 seconds. You may refresh manually by clicking the green refresh button at the top right corner.
System Information #
Basic information related to the appliance: Relianoid Version, Appliance version and hypervisor, kernel version, hostname, and system date.
Farms Information #
The farm section shows an overview of Relianoid Load Balance cores. Relianoid provides load balancing services at various layers and implements key load balance methods.
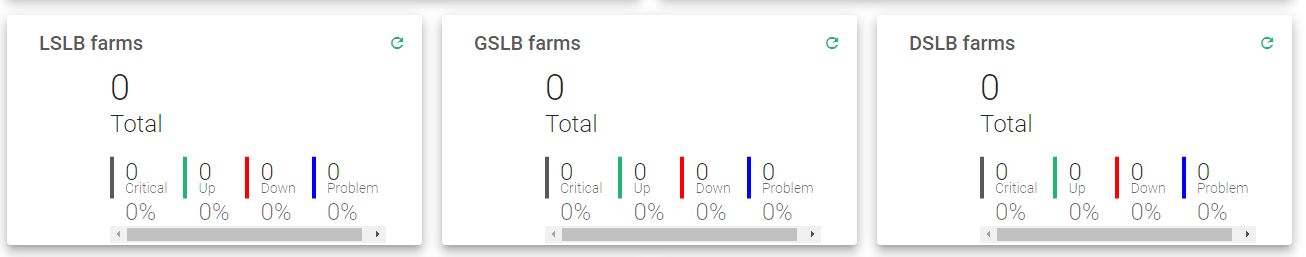
The Available farms include:
LSLB (Local Service Load Balancing). This farm serves virtual services and applications at layer 4 through the L4xNAT profile and layer 7 through the HTTP profile. The incoming connections are managed and shared with the backend using various protocols. Some of these include;
TCP/UDP/SIP/FTP/TFTP/SCTP/AMANDA/H323/IRC/NETBIOS-NS/PPTP/SANE/SNMP/HTTP/HTTPS.
More info
DSLB (Datalink Service Load Balancing). This farm uplinks layer 3 using dynamic load balance routing. This method is also known as SD-WAN More info
GSLB (Global Service Load Balancing). This farm serves domains and data centers using DNS to correctly distribute traffic to the right data centers. More info
Note: Each farm profile shows the total number of servers and their status.
Critical. The farm is up but none of the backends are reachable. They may be down or in maintenance mode.
Up. The farm is running normally.
Down. The farm is totally stopped
Problem. The farm is up but at least one of the backends is not reachable or presents a problem.
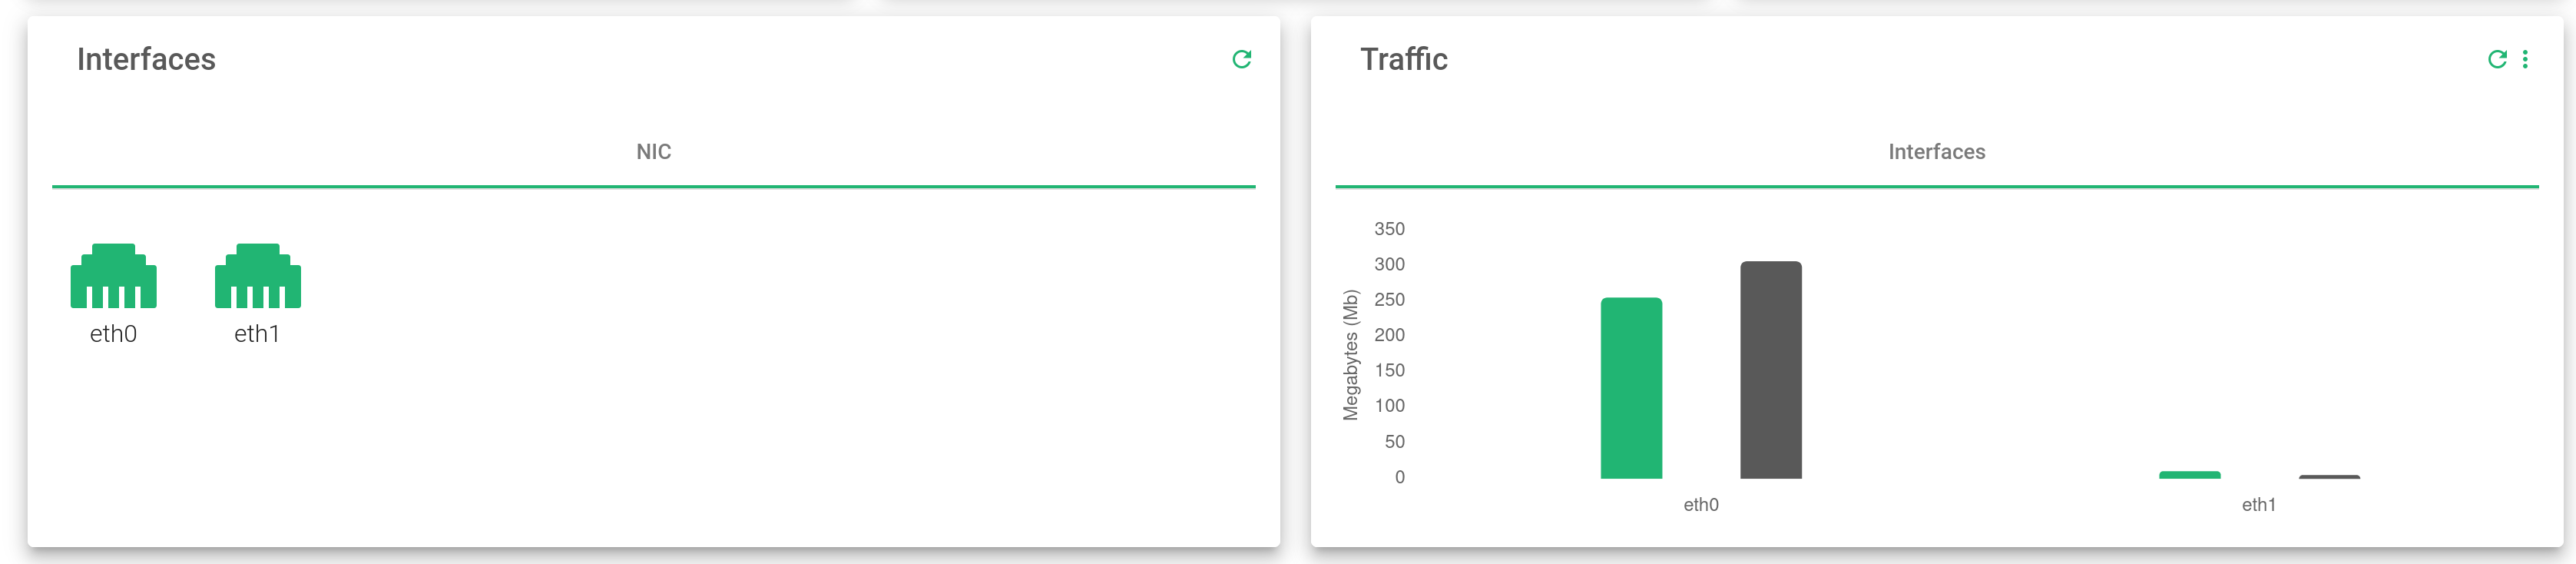
NIC Interfaces #
NIC subsection shows the network interfaces or adapters the servers at the farm are using.
Find more information about inbound and outbound traffic by hovering the cursor over the desired network card(adapter).
You’ll find more information about global and virtual LAN interfaces.
Next step, manage farms.


